
Welcome to this week’s publication of the Market’s Compass Crypto Sweet Sixteen Study #175. The Study tracks the technical condition of sixteen of the larger market cap cryptocurrencies. Every week the Studies will highlight the technical changes of the 16 cryptocurrencies that I track as well as highlights on noteworthy moves in individual Cryptocurrencies and Indexes. As always paid subscribers will receive this week’s unabridged Market’s Compass Crypto Sweet Sixteen Study sent to their registered email*. Past publications including the Weekly ETF Studies can be accessed by paid subscribers via The Market’s Compass Substack Blog.
*In celebration of Groundhog Day, Free subscribers will get a look at this weeks unabridged version today. Unfortunately, Punxsutawy Phil saw his shadow signaling six more weeks of winter. Become a paid subscriber and spend the next six weeks of winter reading The Market’s Compass Crypto Sweet Sixteen Studies.
*An explanation of my objective Individual Technical Rankings go to www.themarketscompass.com. Then go to the MC’s Technical Indicators and select “crypto sweet 16”.
The Excel spreadsheet below indicates the weekly change in the objective Technical Ranking (“TR”) of each individual Cryptocurrency and the Sweet Sixteen Total Technical Ranking (“SSTTR”).
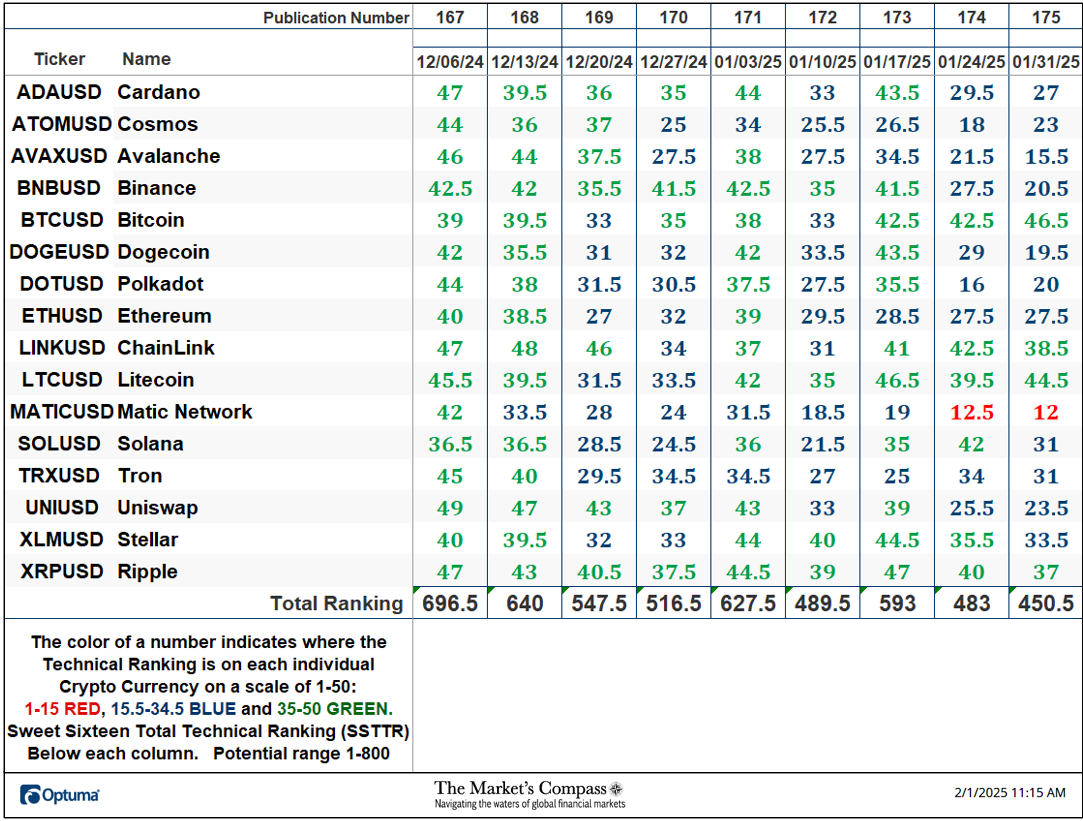
*Rankings are calculated up to the week ending Friday January 31st
After rising 21.11% to 593 three weeks ago the Sweet Sixteen Total Technical Ranking or “SSTTR” fell -6.73% for the second week in a row to 450.5.
Last week all but five of the Sweet Sixteen Crypto TRs fell (one was unchanged) The average Crypto TR loss last week was -2.03 vs. the previous week’s average loss of -6.88. Four ETF TRs ended the week in the “green zone” (TRs between 35 and 50), eleven were in the “blue zone” (TRs between 15.5 and 34.5), and one remained in the “red zone” (Matic Network) vs. the previous week when six TRs were in the “green zone” and nine were in the “blue zone”.
*The CCi30 Index is a registered trademark and was created and is maintained by an independent team of mathematicians, quants and fund managers lead by Igor Rivin. It is a rules-based index designed to objectively measure the overall growth, daily and long-term movement of the blockchain sector. It does so by indexing the 30 largest cryptocurrencies by market capitalization, excluding stable coins (more details can be found at CCi30.com).
A brief explanation of how to interpret RRG charts can be found at The Market’s Compass website www.themarketscompass.com Then go to MC’s Technical Indicators and select Crypto Sweet 16. To learn more detailed interpretations, see the postscripts and links at the end of this Blog.
The chart below has two weeks, or 14 days, of data points deliniated by the dots or nodes. Not all 16 Crypto Currencies are plotted in this RRG Chart. I have done this for clarity purposes. Those which I believe are of higher technical interest remain.
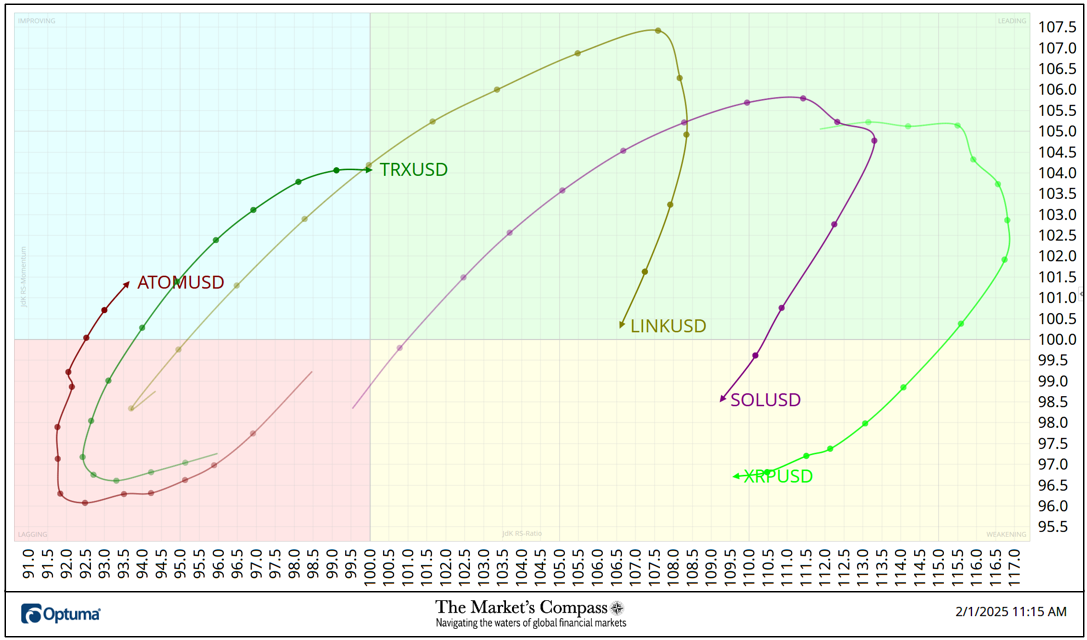
Over the past two weeks both Tron (TRX) and Cosmos (ATOM) have escaped the Lagging Quadrant and have entered the Improving Quadrant. In the case of TRX, it is only one good day on a Relative Strength basis from entering the Leading Quadrant although there was a slowing of Relative Strength Momentum late last week. Ripple (XRP) rolled over in the Leading Quadrant a week ago last Friday and has fallen into the Weakening Quadrant. That weakening of Relative Strength and Relative Strength Momentum was followed by Solana (SOL) and ChainLink (LINK) last week.
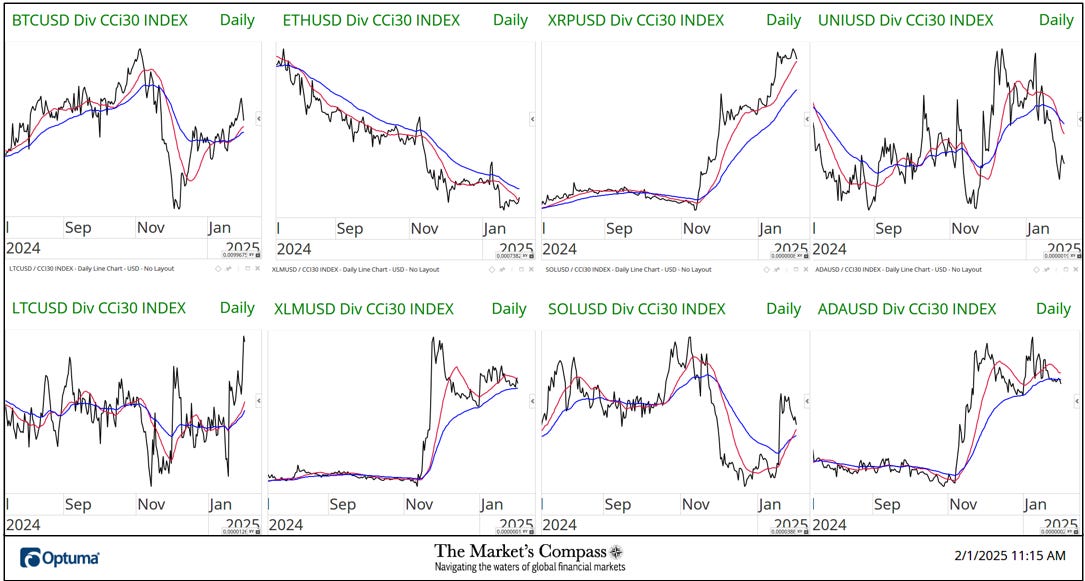
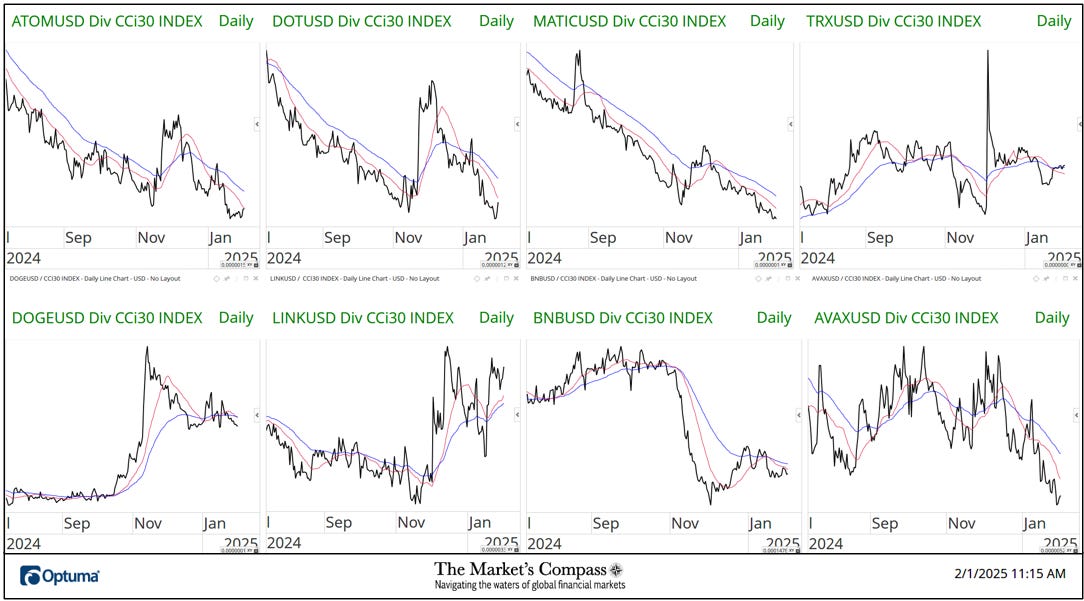
The two charts below are longer term line charts of the Relative Strength or Weakness of the Sweet Sixteen Crypto Currencies vs. the CCi30 Index that are charted with a 55-Day Exponential Moving Average in blue and a 21-Day Simple Moving Average in red. Trend direction and crossovers, above or below the longer-term moving average, reveal potential continuation of trend or reversals in Relative Strength or Weakness.
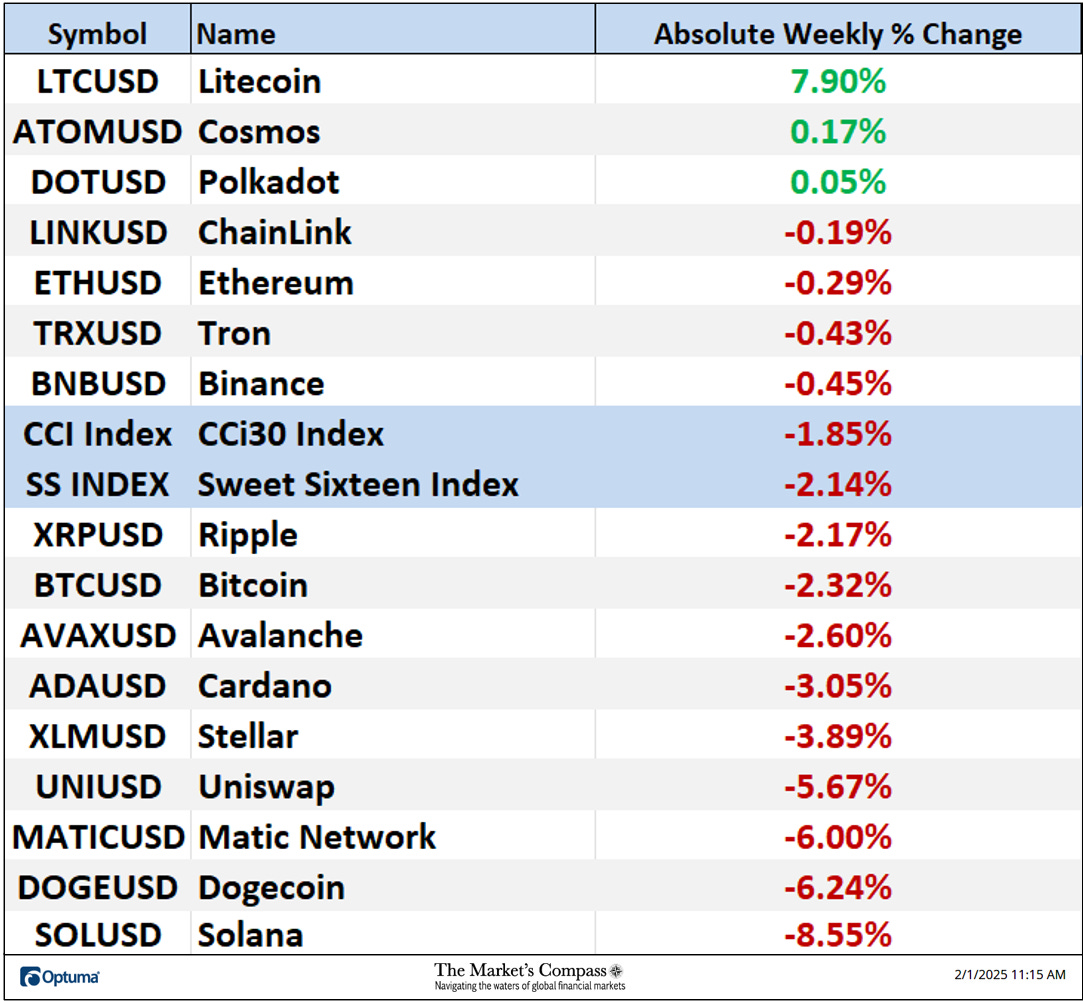
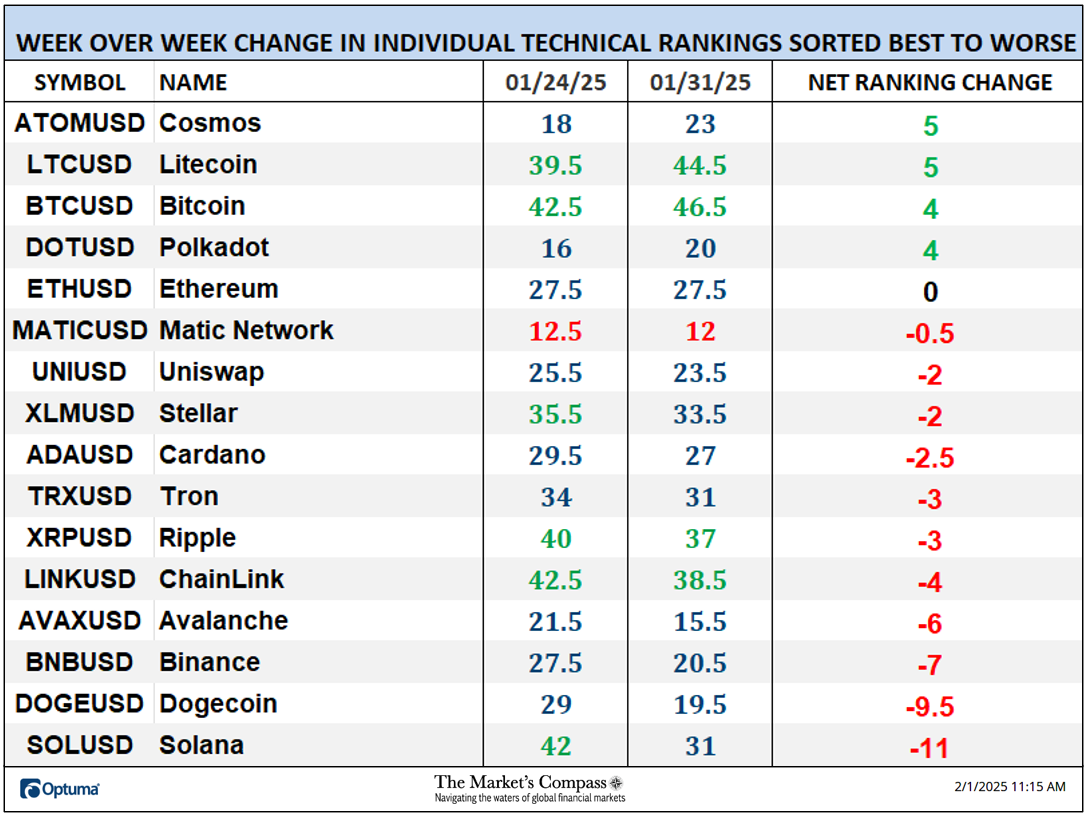
*Friday January 24th to Friday January 31st.
Only three of the Crypto Sweet Sixteen registered absolute gains last week and thirteen lost absolute ground vs. the previous week when four registered absolute gains and tweleve traded lower. The seven-day average absolute price loss was -2.11%, (without the +7.90% gain in Litecoin (LTC) the average loss would have been -2.78%), versus the previous week’s average absolute loss of -5.96%.
*An explanation of my Technical Condition Factors go to www.themarketscompass.com. Then go to the MC’s Technical Indicators and select Crypto Sweet 16.
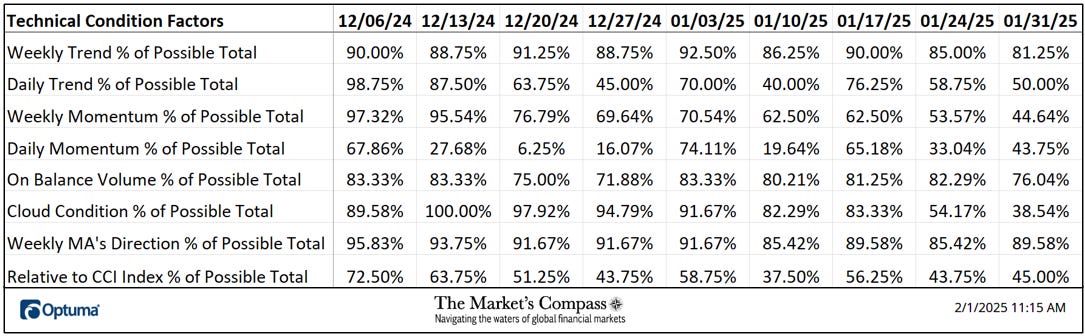
The DMTCF rose slightly last week from a reading of 33.04% or 37 the week before to 43.75% or 49 out of a possible 112.
As a confirmation tool, if all eight TCFs improve on a week over week basis, more of the 16 Cryptocurrencies are improving internally on a technical basis, confirming a broader market move higher (think of an advance/decline calculation). Conversely, if more of the TCFs fall on a week over week basis, more of the “Cryptos” are deteriorating on a technical basis confirming the broader market move lower. Last week five TCFs fell, and only three rose.
For a brief explanation on how to interpret the Sweet Sixteen Total Technical Ranking or “SSTTR” vs the weekly price chart of the CCi30 Index go to www.themarketscompass.com. Then go to the MC’s Technical Indicators and select Crypto Sweet 16.
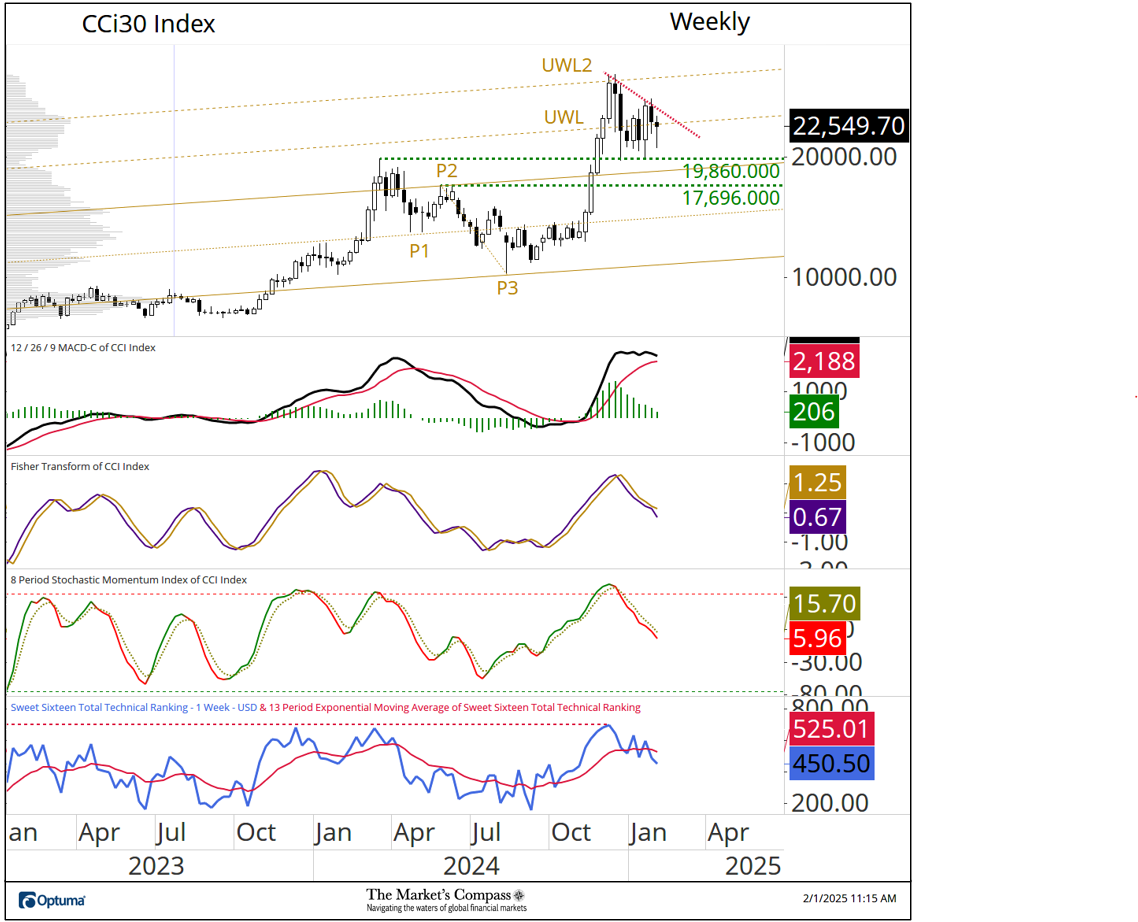
The CCi30 Index remains “trapped” in what the bulls should hope is a triangulating consolidation pattern. Although MACD continues to reflect the obvious loss of upside price momentum it remains elevated in positive territory above its signal line but the shorter-term Stochastic Momentum Index continues to track lower after signaling an overbought condition in early January. My Sweet Sixteen Total Technical Ranking (bottom panel) continues to pull back from overbought territory (red dashed line). As I wrote last week, key to the bullish consolidation technical argument case will be that key support at 19,860 holds and prices are able to overtake the trend of lower highs highlighted with red dashed line.
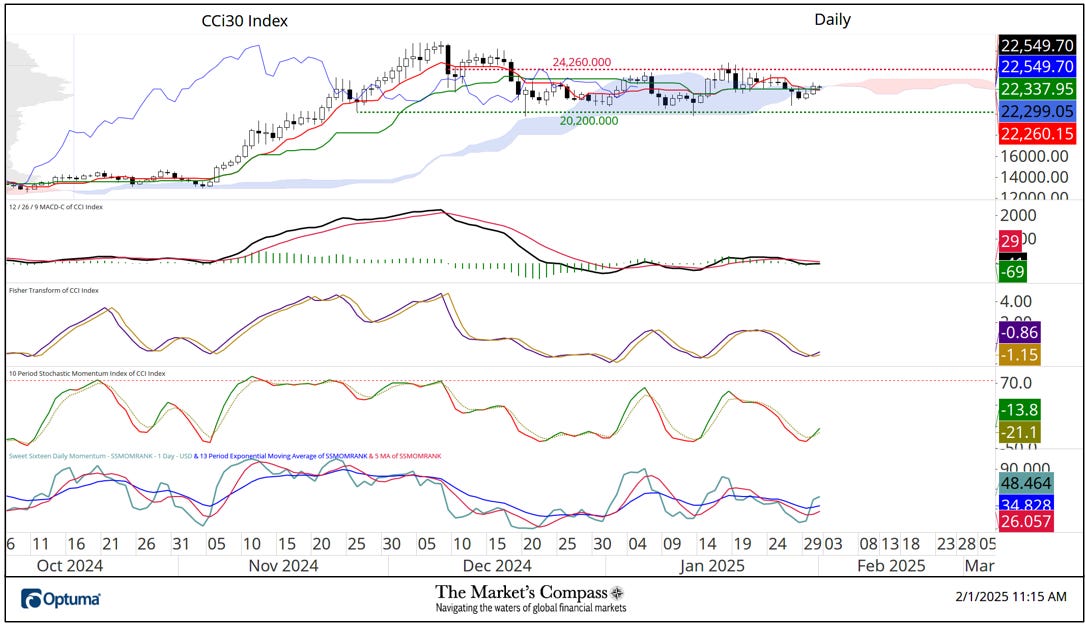
The technical condition of the CCi30 Index on the daily price chart has not changed in a significant way over the past seven days aside from a turn in short-term price momentum as witnessed by the Stochastic Momentum Index and the Fisher Transform retaking the ground above its sinal line. That said, only a rally that advances the Index through key price resistance at the 24,260 level with follow through would suggest that the price action since early December has merely been a period of consolidation prior to new highs.
All the charts are courtesy of Optuma whose charting software enables users to visualize any data such as my Objective Technical Rankings. Cryptocurrency price data is courtesy of Kraken.
Most charting software offers some form of RRG charts, but nothing comes close to Optuma’s, and I urge readers to utilize them on a daily basis. The following links are an introduction and an in-depth tutorial on RRG Charts…
https://www.optuma.com/videos/introduction-to-rrg/
https://www.optuma.com/videos/optuma-webinar-2-rrgs/
To receive a 30-day trial of Optuma charting software go to…
An in-depth comprehensive lesson on Pitchforks and analysis as well as a basic tutorial on the Tools Technical Analysis is available on my website…


